Environmental Preservation Effects in Terms of Overall Reductions in CO2 and Waste Emissions (in comparison with the absence of improvement measures)
| Category |
Item |
Volume of year-on-year reductions |
| Global environmental preservation |
CO2Volume of CO2 emissions (t-CO2) |
11,340 |
| Energy consumption volume in crude oil equivalent (kl) |
6,546 |
| Volume of organic solvent emissions (t) |
-4 |
| Resource recycling |
Volume of landfill waste (t) |
Maintaining complete zero emissions |
| Volume of waste emissions (t) |
1,290 |
| Volume of wastewater discharge (thousand m3) |
-119 |
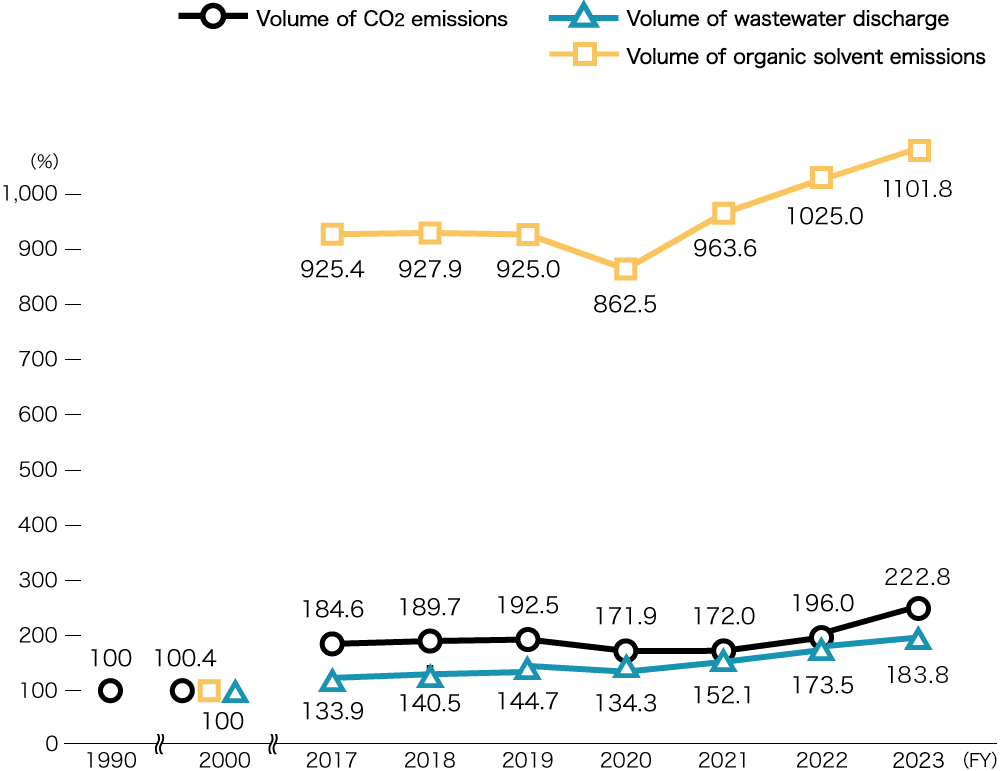
In fiscal 2023, our global environmental preservation activities resulted in reductions of 11,000 tons in the volume of CO2 emissions as well as 7,000 kl in the volume of energy consumption in crude oil equivalent, respectively. These achievements are attributable to the success of energy-saving efforts and the impact of lower production volume. On the other hand, the volume of organic solvent emissions increased by 4 tons. In terms of resource-recycling initiatives, our six factories in Japan achieved complete zero landfill waste (Note 2) the 19th consecutive year since fiscal 2005. Thus, these factories successfully maintained the complete zero-emission status in terms of the volume of waste disposed of by direct landfill. In addition, the volume of waste emissions decreased by 1,290 tons, while the volume of wastewater discharge increased by 119,000 m3.
(Note 2)Complete zero landfill waste: 100% recycling rate and no waste sent directly to landfills. (The Group has defined the overall volume of waste disposed of for the purpose of recycling purposes as the volume of recycled waste.