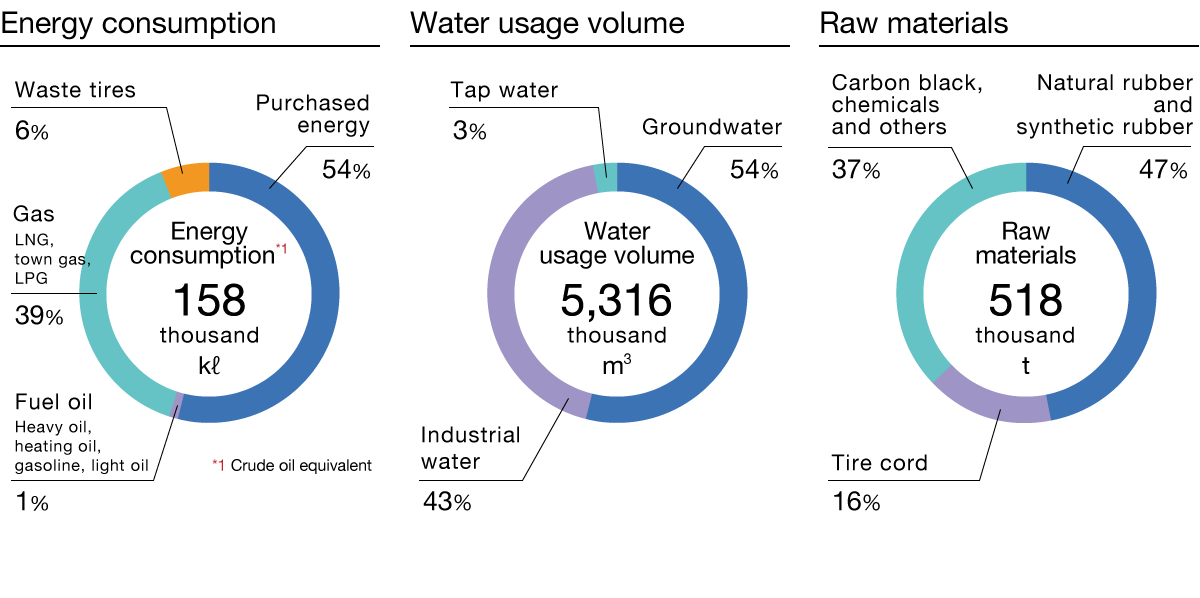
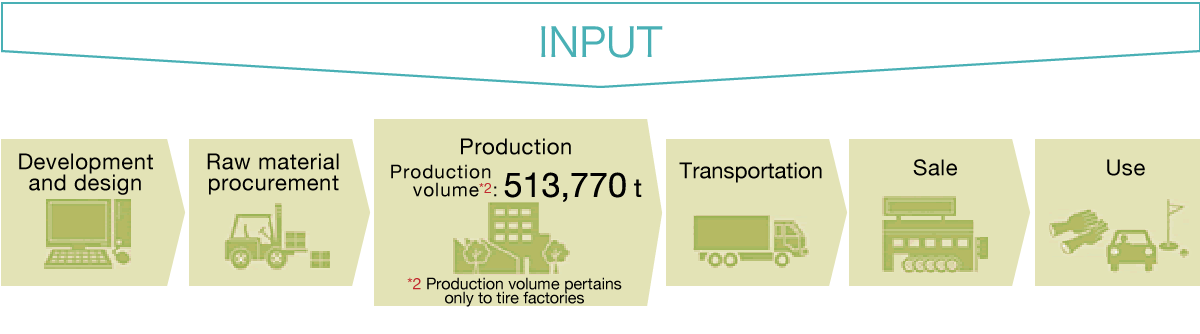
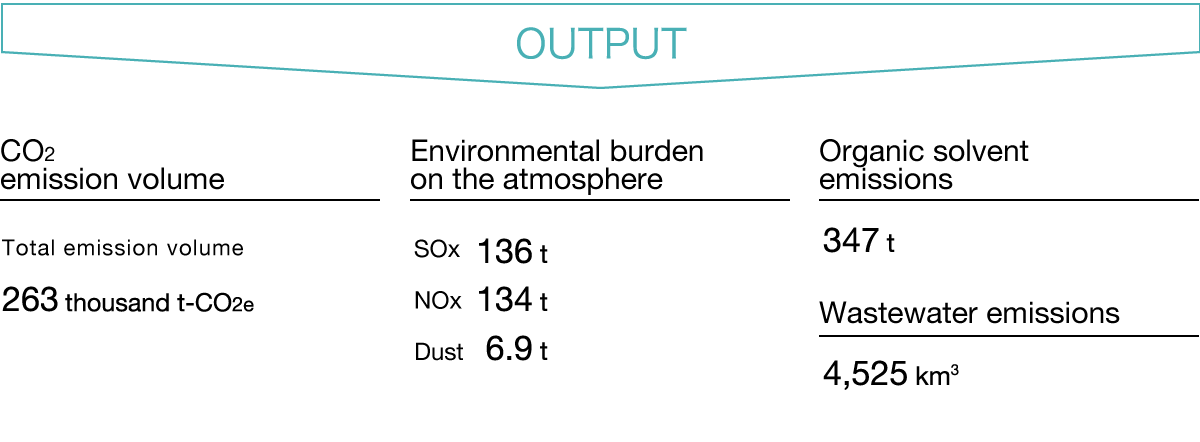
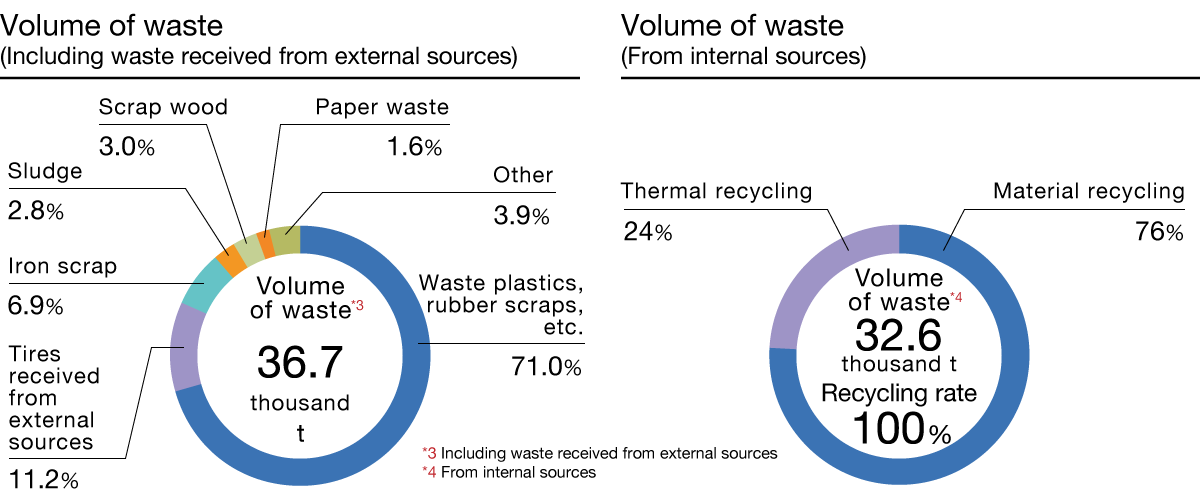
Overview of Business Activities and Environmental Burden
Ecology [Strengthening of our environmental management]
- E ●
- S -
- G -
- Volume of NOx and SOx Emissions
- Prevention of Dioxin Generation
- Appropriate Management of PCB-Containing Equipment
- Reducing Water Usage
- Reducing Water Intake Volumes
- Reduction of Wastewater Emissions and the Purification of Effluent
- Initiatives to Address Water Security Risks
- Our Response to Soil and Water Pollutions
- Management and Reduction of Substances Subject to PRTRs
- Fiscal 2022 Material Flows (six factories in Japan)
Volume of NOx and SOx Emissions
- Sumitomo Rubber Industries, Ltd.
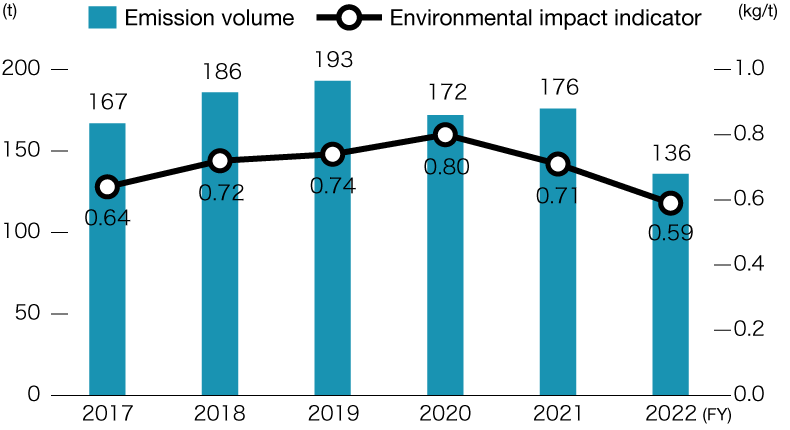
Volume of SOx Emissions and Environmental Impact Indicator
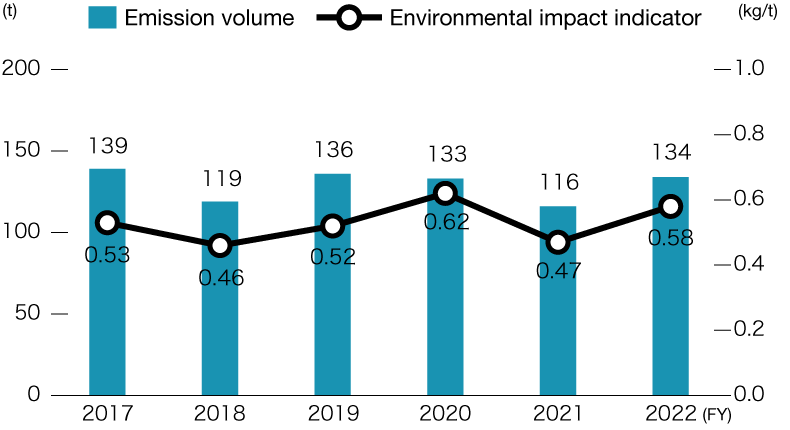
Volume of NOx Emissions and Environmental Impact Indicator
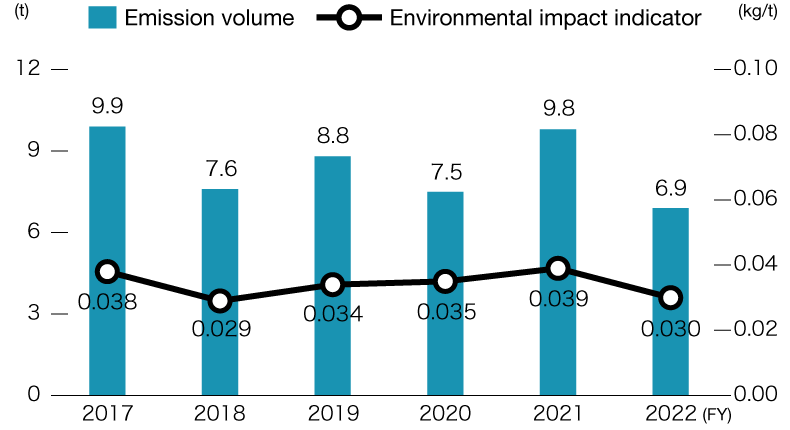
Volume of Dust Emissions and Environmental Impact Indicator
Prevention of Dioxin Generation
- Sumitomo Rubber Industries, Ltd.
Volume of Dioxins (mg-TEQ) Generated
| 2017 | 2018 | 2019 | 2020 | 2021 | 2022 | |
|---|---|---|---|---|---|---|
| Dioxins | 45 | 22 | 21 | 2.6 | 1.0 | 0.7 |
Appropriate Management of PCB*1-Containing Equipment
- The Sumitomo Rubber Group
The Sumitomo Rubber Group stores equipment with PCB content, such as transformers, condensers and stabilizers, at the Nagoya Factory and other domestic production bases and affiliates in a way that complies with the Act on Special Measures concerning Promotion of Proper Treatment of PCB Wastes.*2 The Group also reports the status of such equipment to administrative authorities.
In 2022, we disposed of three transformers and 1,245 stabilizers with PCB content.
As of the end of 2022, equipment with PCB content stored by the Group consisted of seven devices with low-concentration PCB, including transformers, in addition to two stabilizers.
Of these, the two stabilizers were disposed of in March 2023. As for the remaining seven devices with low-concentration PCB, we will systematically work to complete their disposal by the March 31, 2027 deadline.
*1Generic term for polychlorinated biphenyl. PCB is difficult to dissolve in water and chemically stable while boasting good insulation properties. Because of these features, PCB has been used as an insulation oil for use in transformers, condensers and other devices. However, it is now confirmed that PCB is hazardous to human health as well as the environment. Moreover, because it resists decomposition, residual PCB is known to be present in diverse areas of the environment.
*2Enforced in 2001 and revised in 2012 and 2016.
Reducing Water Usage
- The Sumitomo Rubber Group
In light of the global shortage of water resources, we work to reduce our water usage volume.
In fiscal 2022, total water usage at all Sumitomo Rubber Group factories decreased 5.0% year on year, while the volume of wastewater fell 17.2% year on year.
We will continue our ongoing efforts to counter these trends, pushing forward with water usage optimization in production processes at each base as well as measures that utilize the results of assessments based on the WRI* Aqueduct Water Risk Atlas.
*WRI:World Resources Institute
Reducing Water Intake Volumes
- The Sumitomo Rubber Group
Volume of Water Intake by Water Source
(1,000 m3)
| Fiscal | 2018 | 2019 | 2020 | 2021 | 2022 | |
|---|---|---|---|---|---|---|
| Total water intake volume | 13,623 | 13,269 | 12,432 | 12,875 | 11,318 | |
| Surface water | 1,904 | 2,529 | 2,689 | 1,906 | 1,204 | |
| Surface brackish water and sea water | 0 | 0 | 0 | 0 | 0 | |
| Groundwater (renewable) | 4,938 | 3,980 | 3,642 | 4,207 | 4,116 | |
| Groundwater (non-renewable) | 0 | 0 | 0 | 0 | 0 | |
| By-product water and contaminated water | 0 | 0 | 0 | 0 | 0 | |
| Third-party water sources | 6,761 | 6,760 | 6,101 | 6,762 | 5,998 | |
*Surface water and third-party water sources were redefined as separate categories in 2020.
*Figures were retrospectively restated due to changes in the scope of calculation.
Reduction of Wastewater Emissions and the Purification of Effluent
- The Sumitomo Rubber Group
The Sumitomo Rubber Group is striving to reduce its volume of water intake and recycle wastewater, with the overall aim of addressing the depletion of water resources worldwide. In summer 2020, our Turkey Factory became the first Sumitomo Rubber Group base to achieve a100% factory wastewater recycling rate.
We also conduct the periodic measurement of such water quality indicators as hydrogen ion concentration (pH), biochemical oxygen demand (BOD) and concentration of suspended solids (SS) to ensure the appropriate management of effluent.
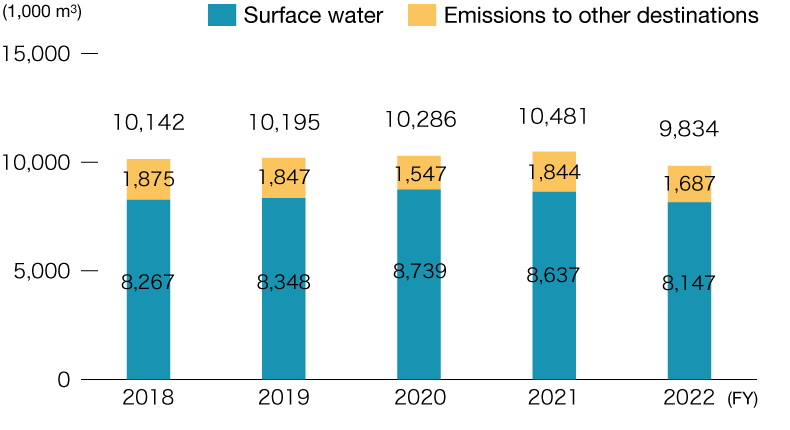
Volume of Wastewater Discharge by Destination
(1,000 m3)
| Fiscal | 2018 | 2019 | 2020 | 2021 | 2022 | |
|---|---|---|---|---|---|---|
| Total wastewater emissions | 10,142 | 10,195 | 10,286 | 10,481 | 9,834 | |
| Surface water | 8,267 | 8,348 | 8,739 | 8,637 | 8,147 | |
| Surface blackish water and seawater | 0 | 0 | 0 | 0 | 0 | |
| Groundwater | 0 | 0 | 0 | 0 | 0 | |
| Emissions to other destinations | 1,875 | 1,847 | 1,547 | 1,844 | 1,687 | |
*Figures include values estimated by some affiliates and overseas factories based on their water usage volumes. Surface water and third-party water sources were redefined as separate categories in 2020.
*Figures were retrospectively restated due to changes in the scope of calculation
Wastewater Data by Factory
Data regarding the status of wastewater by factory is posted on webpages for each factory.
Sustainability Initiatives Undertaken by Manufacturing Bases (Japanese only)Initiatives to Address Water Security Risks
- The Sumitomo Rubber Group
Business activities undertaken by the Sumitomo Rubber Group involve the use of water in the course of producing raw materials and manufacturing products. Accordingly, we have positioned appropriate water resource management as an important business issue that must be addressed as part of our Long-Term Sustainability Policy.
Water Security Risk Assessment and Evaluation
The Sumitomo Rubber Group has been conducting assessments based on the Aqueduct Water Risk Atlas, a tool provided by the WRI.* In addition, we employ our own standards regarding legal compliance, limitations on water intake and other items to conduct risk assessments for our bases.
In these ways, we will continue to perform risk assessments for our major production bases to determine which bases may be at high risk and thereupon implement concrete countermeasures.
*World Resources Institute
Reducing Water Intake Volumes and Recycling Wastewater
The Sumitomo Rubber Group is striving to reduce its volume of water intake and recycle wastewater, with the overall aim of addressing the depletion of water resources worldwide. In summer 2019, our Turkey Factory became the first Sumitomo Rubber Group base to achieve a 100% factory wastewater recycling rate.
Our Response to Soil and Water Pollutions
- The Sumitomo Rubber Group
Soil and Water Pollution at the Kakogawa Factory (follow-up reporting)
In October 2004, we notified Kakogawa City of the fact that voluntary surveys conducted to determine the content of tetrachloroethylene and other hazardous substances in soil on the Kakogawa Factory’s premises found levels in excess of statutory environmental standards. Simultaneously, we hosted briefings for neighboring residents.
Since then, we have striven to counter the pollution by removing the contaminated soil, purifying contaminated groundwater on an ongoing basis and implementing bio-purification measures to invigorate indigenous soil microorganisms.
Based on follow-up surveys conducted to date, we have confirmed that pollutants have not been dispersed outside the factory’s premises, with their residual presence now narrowed down to limited areas. We continue to periodically sample the groundwater to constantly monitor the status of pollutions.
Tetrachloroethylene Concentration Measured via Sampling from the Groundwater Wells (ongoing monitoring points)
Note: The value measured via sampling from the initial monitoring point has been stable at less than 0.01 mg/l. We therefore installed an additional monitoring point in an adjoining polluted area in 2016. The benchmarking value is set at 0.01 mg/l or lower.
(mg/L)
| Mar. 2021 |
Jun. 2021 |
Sep. 2021 |
Dec. 2021 |
Mar. 2022 |
Jun. 2022 |
Sep. 2022 |
Dec. 2022 |
|
|---|---|---|---|---|---|---|---|---|
| Concentration measured at monitoring points | 0.012 | Less than 0.001 | 0.001 | Less than 0.001 | Less than 0.001 | 0.002 | Less than 0.001 | Less than 0.001 |
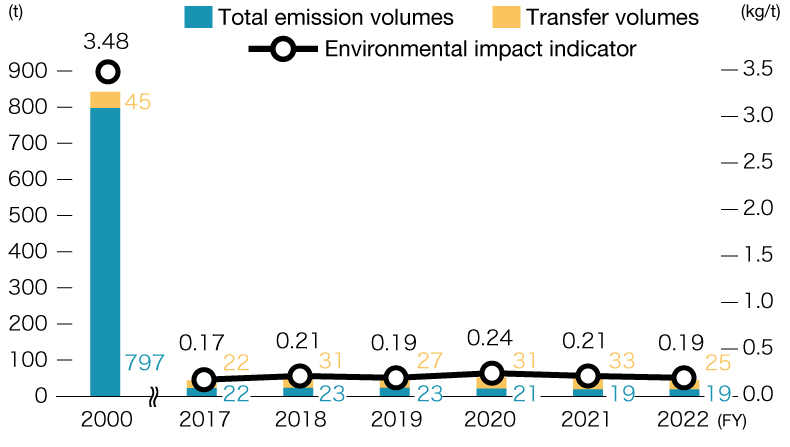
Management and Reduction of Substances Subject to PRTRs
- Sumitomo Rubber Industries, Ltd.
Volume of Emissions and Transfer of Substances Subject to PRTRs and Environmental Impact Indicator (six factories in Japan)
Fiscal 2022 Material Flows (six factories in Japan)
- The Sumitomo Rubber Group